Right now, the U.S. housing market is showing a clear split. In certain states, buyers are finding more opportunities, while in others, sellers continue to hold the advantage. It all depends on where you are. Curious about how your state compares?
These three insightful maps illustrate how this divide is shaping markets across the country. In each map:
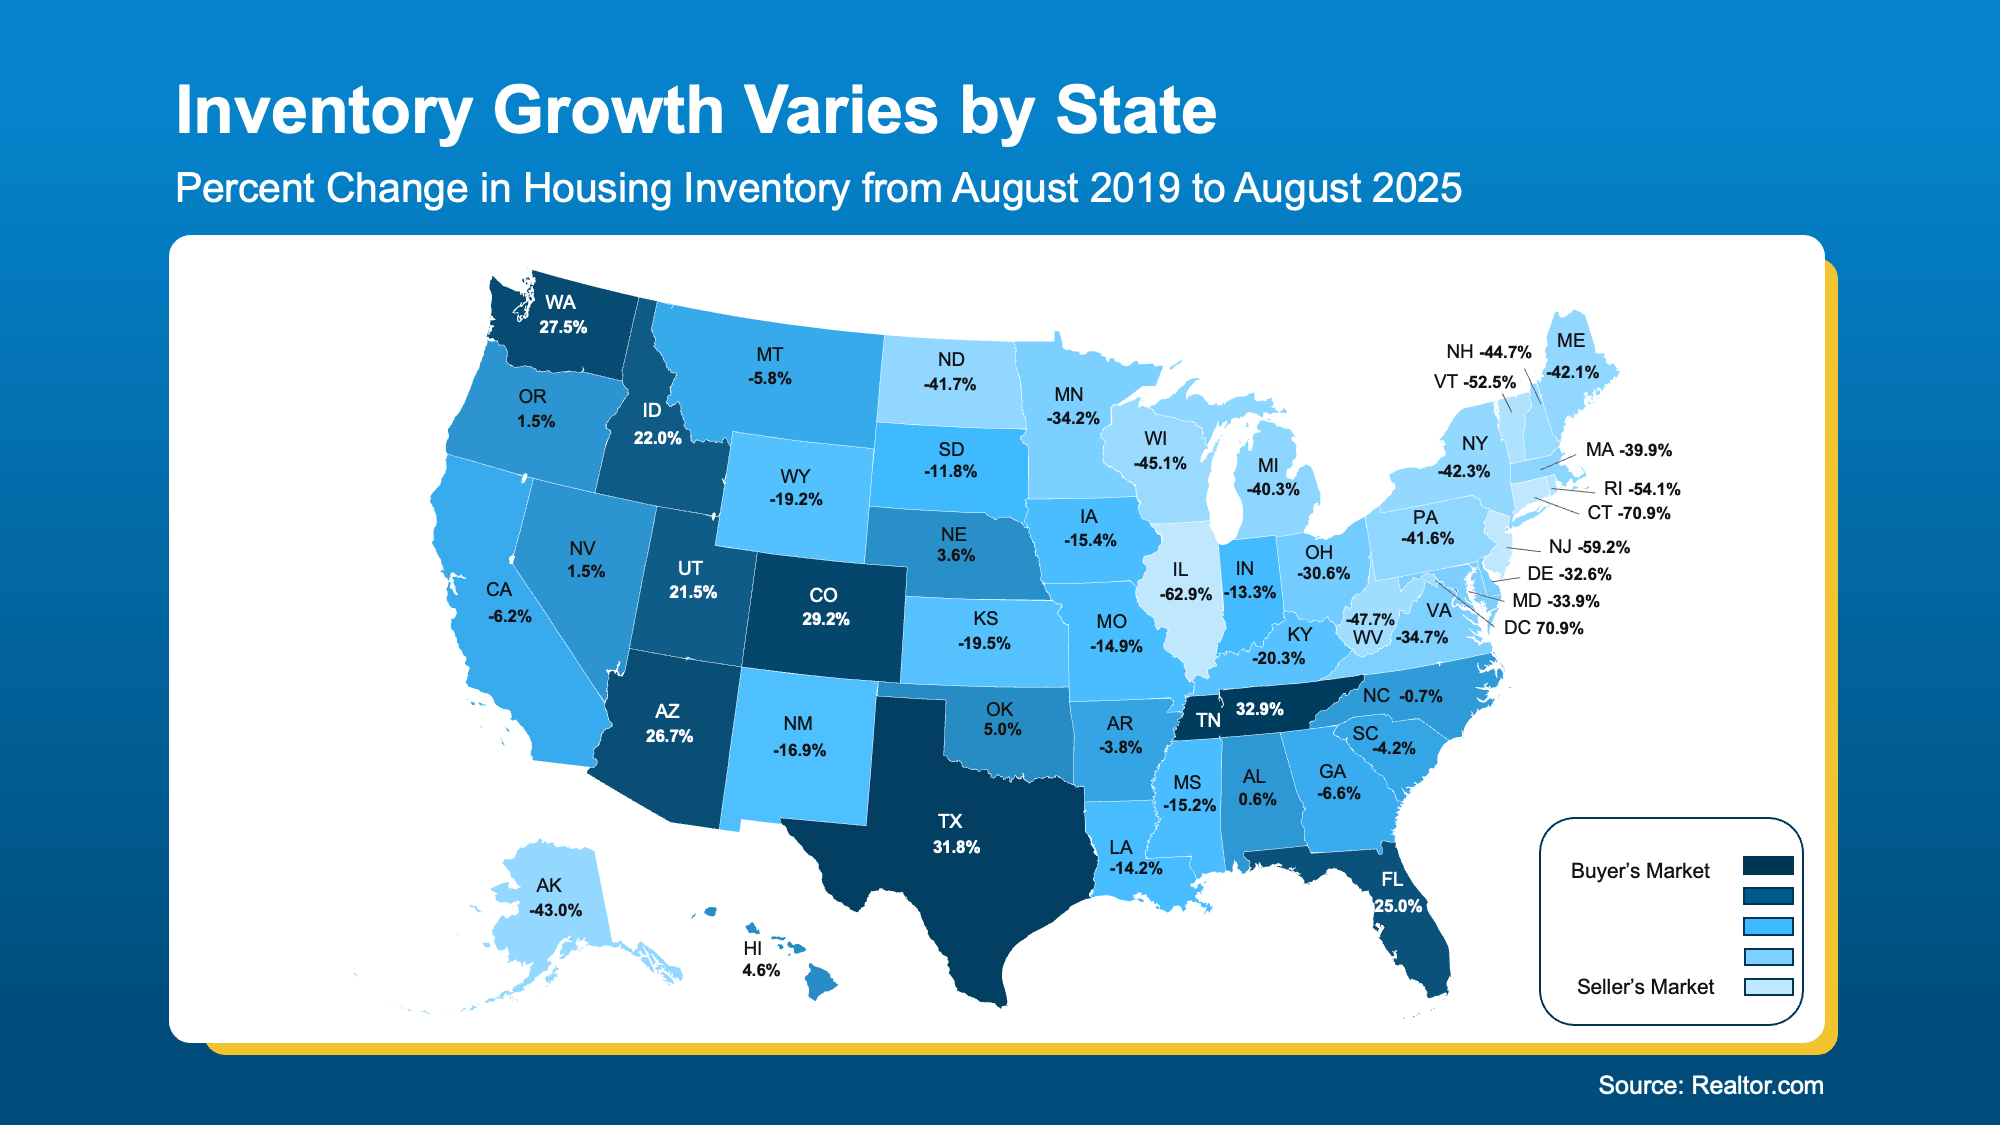
Darker Shades of Blue = More favorable for buyers
Lighter Shades of Blue = More favorable for sellers
Inventory Growth Sets the Foundation
The number of homes for sale is increasing across much of the country, but the pace of that growth varies significantly depending on location. This variation plays a major role in determining who currently has the upper hand—buyers or sellers.
This map, based on data from Realtor.com, provides a helpful breakdown:
In areas shaded in darker blue, inventory has grown more significantly, giving buyers a wider selection of homes and more negotiating power. These markets offer a great opportunity for those looking to purchase a home with fewer obstacles. On the other hand, lighter blue areas still have relatively low inventory, making it easier for sellers to sell quickly and potentially with fewer concessions.
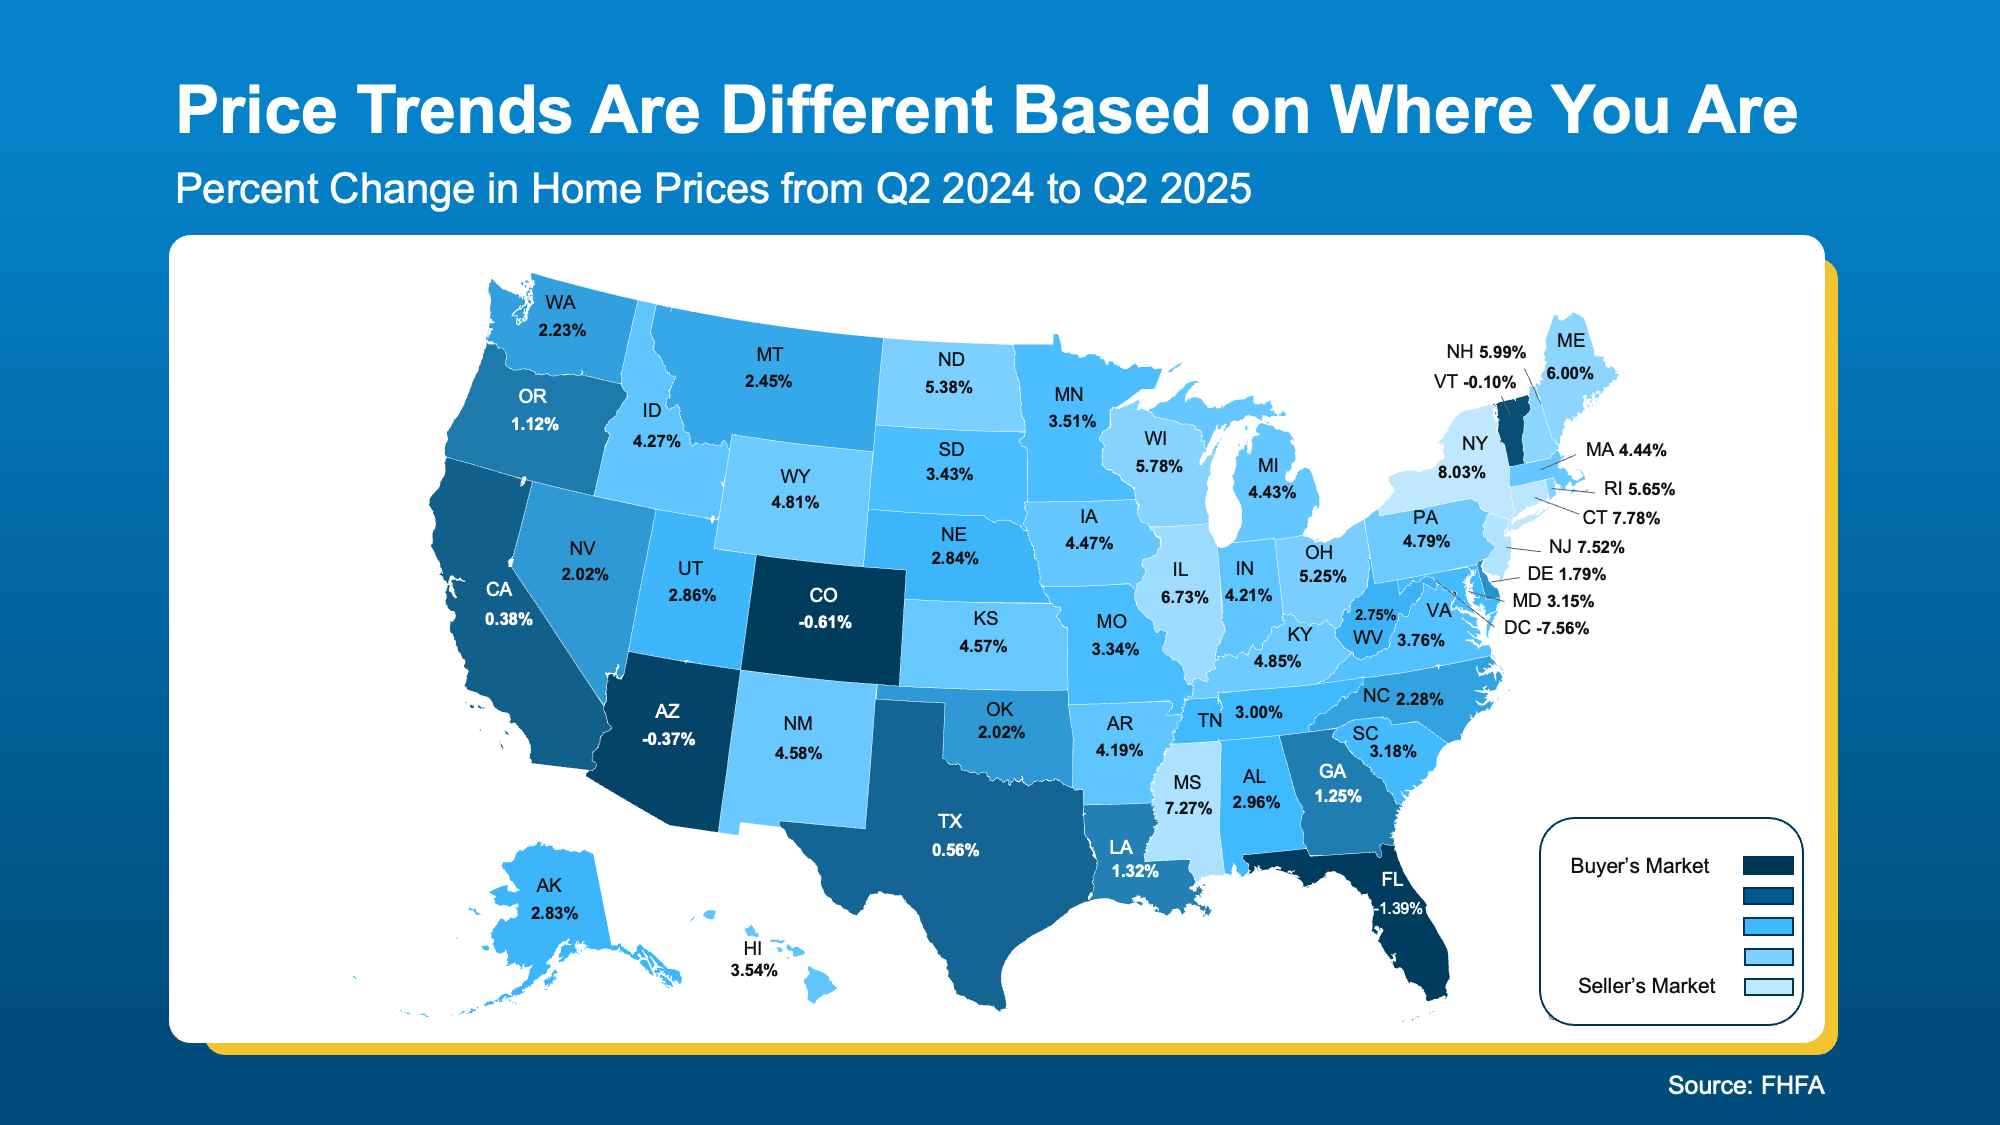
Price Trends Reflect Inventory Shifts
The second map highlights how home prices are responding to changes in inventory. Much like the first map, you’ll see a clear regional divide. Many of the areas experiencing inventory increases are also seeing price moderation.
Darker blue states show where prices have either slightly declined or stabilized. This is great news for budget-minded buyers, as it means more affordable options may be availables in these regions may need to be open to price adjustments or offer incentives to close a deal. Conversely, the lighter blue areas continue to see rising home prices due to limited inventory and ongoing buyer demand. If you're selling in one of these states, your home might still attract multiple offers.
Time on Market Reinforces the Trend
The third map reveals how long homes are taking to sell across different states. Once again, the color patterns align with the earlier trends—darker blues generally indicate states where homes are sitting on the market longer.
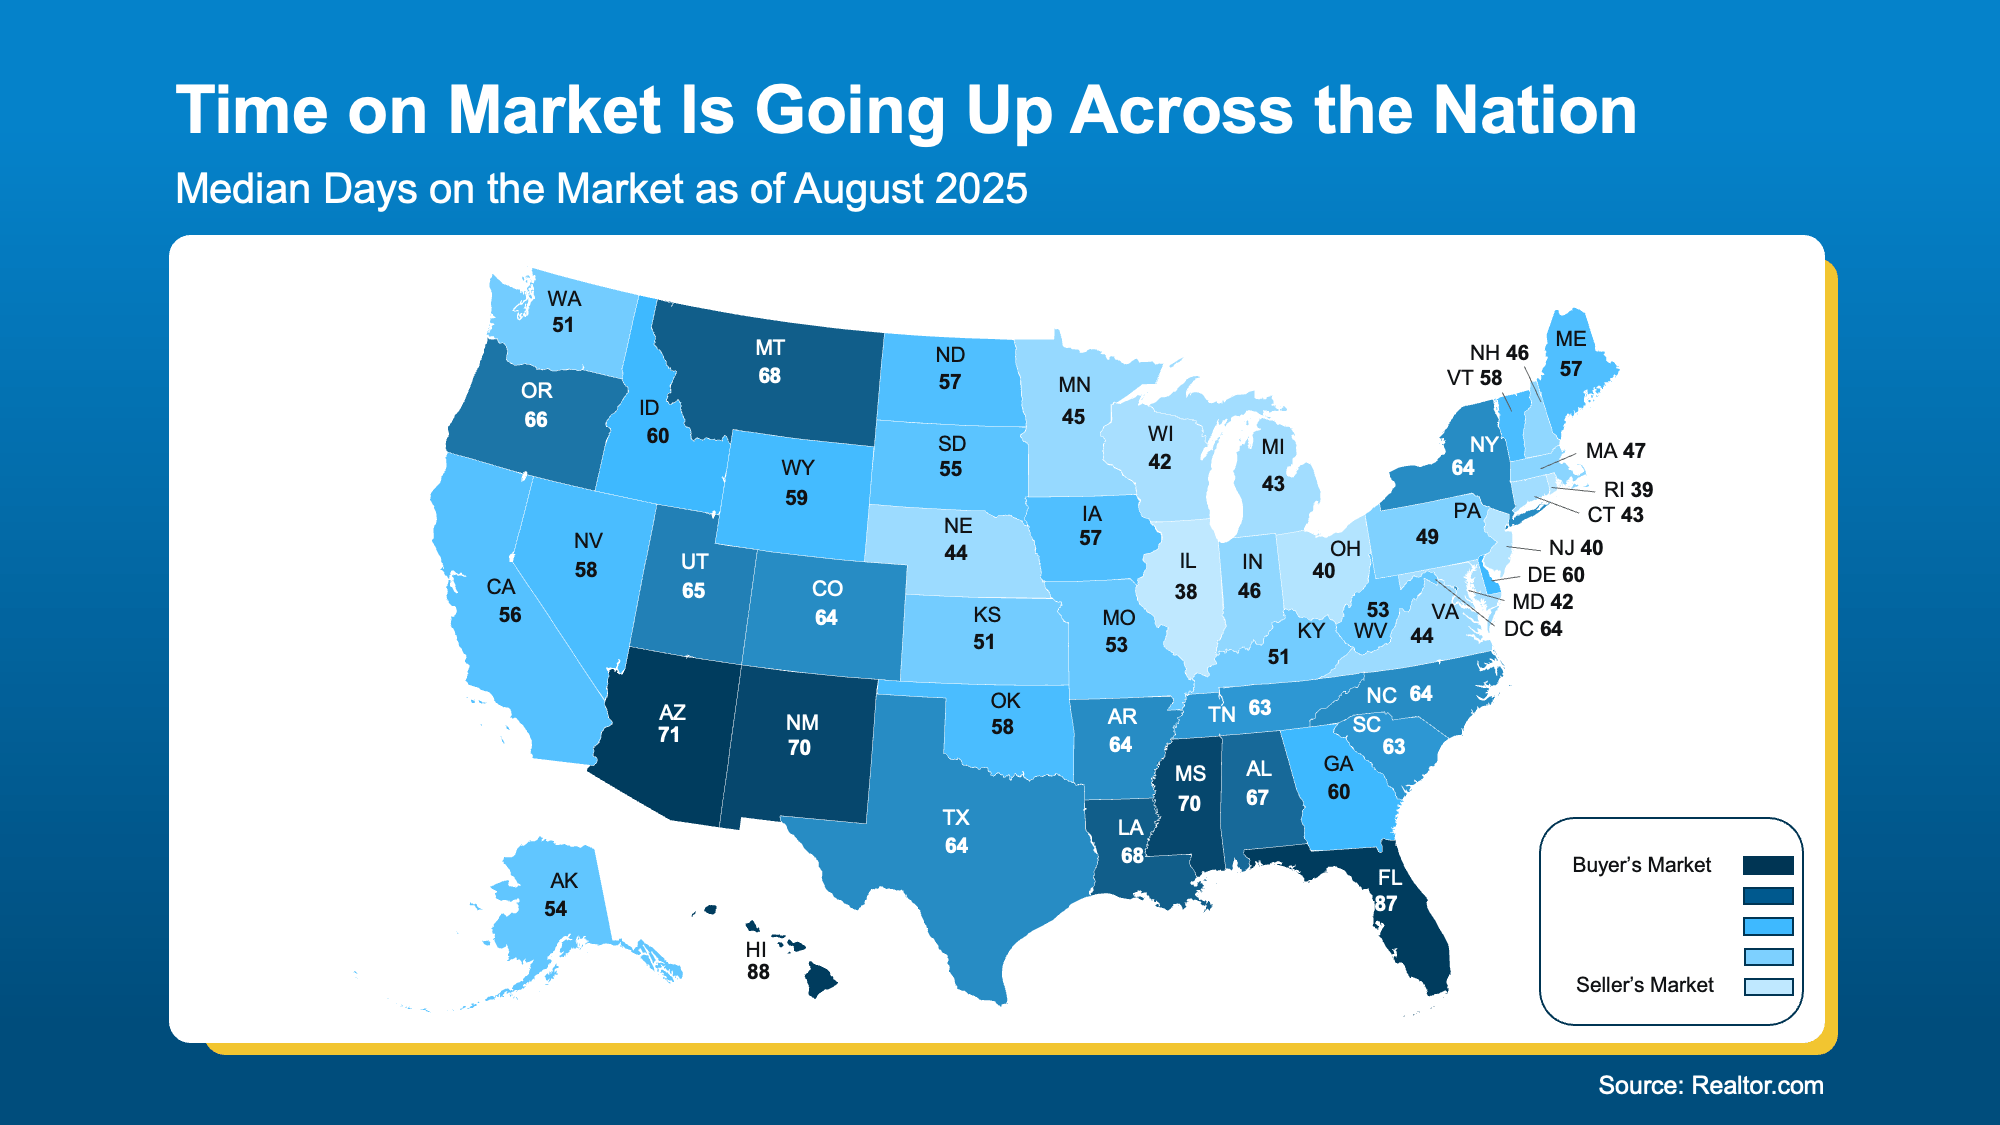
Where inventory has increased, homes tend to take more time to sell. This extra time can be a positive for buyers who want to carefully consider their options. In these markets, sellers might need to be more flexible with pricing and terms. Meanwhile, the areas are seeing faster sales, which can encourage sellers and require buyers to act promptly. This contrast helps explain why sellers in some markets feel their homes are lingering, while others are closing deals quickly.
Why Local Expertise Matters Most
While state-level data offers a helpful overview, real estate is ultimately hyper-local. Market conditions can vary not just by state, but from one neighborhood to the next. That’s why working with a knowledgeable local agent is so important. They can provide detailed insights specific to your area, whether you’re buying, selling, or both.
Bottom Line
Curious about where your local market stands? Whether you're navigating a buyer-friendly or seller-strong environment, a local expert can give you the clarity and confidence you need to make smart decisions.
If you’re ready to understand what today’s housing market means for your neighborhood, the best first step is connecting with a trusted local real estate professional. Reach out to Mike Panza and the team at Panza Home Group for personalized advice and insights tailored to your area. You can learn more or get in touch here: https://panzarealestate.com/team/mike-panza